Dr Matthew Thomas,
Social Policy and Alicia Hall, Statistics and Mapping
Key Issue
The high cost of housing in Australia has been at the forefront of a range of recent policy debates concerning Australia’s taxation arrangements. This brief examines housing affordability in Australia for both owners and renters over recent decades. It focuses particularly on those households which are most affected by high housing costs—those on low incomes in the private rental market.
What is housing
affordability?
The term ‘housing
affordability’ usually
refers to the relationship between expenditure on housing (prices, mortgage
payments or rents) and household incomes. The concept of housing affordability
is different to the concept of ‘affordable housing’, which refers to low-income
or social housing.
Affordability for
owners
Housing affordability in Australia has broadly declined
since the early 1980s. The OECD’s price to
income ratio index shows a 78% increase between
1980 and 2015. In Sydney, which has experienced significant price rises over
the period, Parliamentary Library calculations indicate that the ratio of average
disposable household income (Australia-wide) to median house prices has
increased from approximately 3.3 in June 1981, to just over seven in June 2015.
The following graph illustrates Australia-wide ratios from
the early 1970s to 2012.
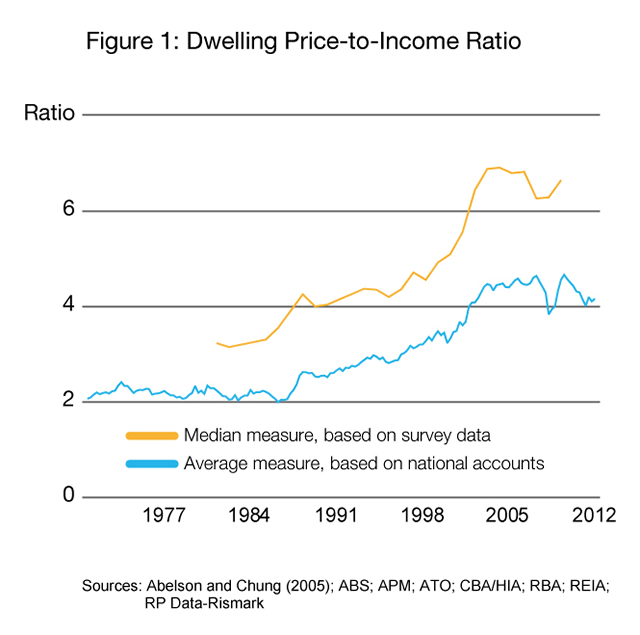
Source: R Fox and R Finlay, Dwelling
prices and household income, RBA Bulletin, December Quarter 2012.
Much of the growth in housing prices relative to
incomes took place during the
late 1980s, 1990s and early 2000s. In this context, the Reserve Bank of
Australia’s 2014 submission
to the Senate
Economics References Committee Inquiry into Affordable Housing noted ‘Australian
housing prices increased by about two thirds relative to income in the decade
or so up to around the end of 2003’.
Partly as a consequence of rising house
prices between 1984 and 2009–10, the Australian Bureau of Statistics’ (ABS) Household Expenditure
Survey
indicates that the estimated proportion of average weekly household expenditure
on current housing increased from approximately 12.8% to 18.0%. Some of this
increase is likely to represent changing societal preferences, with households choosing
to put more of their household budget into larger, more comfortable or better-located
homes. This has been facilitated through financial deregulation and a
significant growth in household disposable incomes between 1980 and 2010.
Of course, affordability differs between the states
and territories, and between capital cities and regional areas. As an
indication, Table 1 shows nominal median house prices in each of the capital
cities in March 1980, and March 2016.
Table 1: Capital cities’ nominal median
house prices
| |
March
1980 |
March
2016 |
| Sydney* |
$64 800 |
$999 600 |
| Melbourne |
$40 800 |
$713 000 |
| Brisbane* |
$34 500 |
$480 000 |
| Adelaide |
$36 300 |
$445 000 |
| Perth |
$41 500 |
$520 000 |
| Canberra |
$39 700 |
$570 000 |
| Hobart |
Not available |
$385 000 |
| Darwin |
Not available |
$582 500 |
Source: Time series data purchased from
the Real Estate Institute of Australia by the Parliamentary Library. *REIA
advises that comparisons over time for Sydney and Brisbane should be made with
caution.
Rising house prices are one factor behind the
declining levels of home ownership in Australia. The 2016 Household,
Income and Labour Dynamics in Australia Survey: Selected Findings from Waves 1
to 14 reports that, in 2001, 68.8% of
households were owner-occupied, compared to 64.9% in 2014. This trend is most
prevalent in Victoria (7.8 percentage point decline) followed by New South
Wales (4.3 percentage point decline), and South Australia (2.5 percentage point
decline).
Measurements of housing affordability
There are two major approaches to the measurement of housing affordability in policy discussions in Australia—ratio measures and residual measures. Ratio measures focus on the relationship between housing expenditure (prices or costs) and household income, either as a median or mean. The ABS, the OECD and various housing industry associations publish ratio measures. As outlined by Gabriel, Jacobs, Arthurson, Burke and Yates in their 2005 paper Conceptualising and measuring the housing affordability problem, residual measures emphasise the capacity of a household to maintain an acceptable standard of living after housing costs. Given the level of complexity associated with their calculation, residual measures are typically published by researchers and academics.
Affordability for
renters
The ABS’ Housing
Occupancy and Costs publication indicates that between 1994–95 and 2013–14,
the proportion of households which are renters has increased from 26% to 31%.
In addition, the proportion of households renting from private landlords has
increased from 18% to 26% over the same period.
On average, private renters spend more of their gross
household income on housing costs than other tenure types. Specifically, the ABS
reports private renters spent 20% of their gross household income on
housing costs in 2013-14, compared with 16% for those with a mortgage.
The cost of renting privately has increased
significantly over the period between
1994–95 and 2013–14. The ABS’ Housing
Occupancy and Costs publication indicates a 62% increase in average weekly housing costs
(after inflation). This compares to a 42% increase for owners with a mortgage
and 45% for public renters.
What is housing stress?
A household is typically described as being in ‘housing stress’ if it is paying more than 30% of its income in housing costs. As higher income households can spend a higher proportion of their income on housing without experiencing problems, they are often excluded from these types of analysis. Consequently, a ratio of 30/40 is often used as a benchmark—that is, if households that fall in the bottom 40% by income spend more than 30% of their income on housing, they are defined as being in housing stress. Confusingly, both gross and disposable incomes are referenced by researchers when referring to housing stress.
Affordability in
the private rental market for those on low incomes
Much of the recent public debate about housing
affordability has focused on the inability of many would-be home owners—and
young people in particular—to break into the property market, and factors
contributing to this. Rather less attention has been paid to the difficulties
faced by low-to-medium-income earners who are obliged to compete with people on
higher incomes for a limited number of affordable rental properties in the
private rental market in areas with greater employment opportunities.
In 2012, the National Housing Supply Council (NHSC)
estimated
that as at 30 June 2011, the gap between overall housing supply and demand was
228,000 dwellings. The NHSC also estimated that there was a deficit of 539,000
affordable rental properties for lower income renters. Anglicare Australia’s
annual rental affordability snapshots suggest that the situation for lower
income renters remains difficult. The latest
Anglicare survey of 75,410 rental properties across Australia, conducted in
April 2016, found that at a national level, only 21 properties were affordable
for single adults living on Newstart Allowance, and only one was suitable for a
single person living on Youth Allowance.
In this context, an increasing number of Australian
renter households are experiencing housing stress. In 2013–14, the ABS found
50.1% of low-income renter households
had housing costs greater than 30% of gross household income (which includes
Commonwealth Rent Assistance (CRA)). While the
provision of CRA has helped
to reduce the number of Australian households in housing stress, Parliamentary
Library calculations indicate that for a substantial and growing proportion of
people renting in certain parts of Australia, rental costs are rising at a
higher rate than CRA thresholds and rates.
For those low-income households in greatest need,
the federal, state and territory governments provide social housing. However,
the stock of social housing is not increasing at a rate sufficient to keep up
with demand, and waiting lists for social housing remain long. At
30 June 2015, there were 199,133 households on social housing waiting lists.
Government response
Housing affordability
did not receive significant attention during the 44th Parliament. The
Government had committed to undertake a
review of housing and homelessness policies and programs as part of the reform
of the federation white paper process, with housing issues also to be
considered as part of the white paper on the reform of Australia’s tax system.
However, the status of this review is unclear given the cessation of both of
the white papers.
On 7 January 2016, the Government announced that the COAG Council
on Federal Financial Relations would form an Affordable Housing Working Group.
This group has been charged with identifying ways of increasing the supply of
affordable housing for people on low incomes and implementing trials of models
of such arrangements. To this end, the Working Group released an issues paper and called for
submissions on ways to boost the supply of affordable rental housing through
innovative housing models. The consultation process
was completed on 6 April 2016.
If the supply of affordable housing is to be increased
sufficiently to meet medium- to long-term demand, then this could be met
through (among other things) institutional investment in the affordable end of
the residential market.
The main barrier to such investment would
appear to be that institutional investors have shown
relatively little interest in affordable housing, largely due to perceptions of
risk and affordable housing’s comparatively low returns. If investors’
reluctance is to be overcome then it is likely that this will require
government incentives and the introduction of some form of financial instrument
(similar to the discontinued National Rental Affordability Scheme).
The Affordable Housing Working Group is currently
considering the merits of a number of such instruments and Australian Housing
and Urban Research Institute (AHURI) researchers have undertaken a significant
amount of research on Housing Supply Bonds and an Affordable Housing Finance
Corporation Model.
Financing instruments such as these could help to
increase the supply of affordable housing over the longer term. However, if low-income
households currently experiencing housing stress are to gain some respite, then
this might suggest the need for a more immediate response. Such a response
could include changes to the levels and indexation of CRA to ensure that it
better reflects the costs of rental housing, as recommended by the Henry
Review of the tax system and the McClure
Review of the welfare system.
Further reading
Senate Select Committee on Housing Affordability, A good house is hard to find: housing affordability in Australia, The Senate, Canberra, 2008.
National Housing Supply Council, Housing supply and affordability reform, Commonwealth of Australia, 2012.
Australia’s Future Tax System Review, Australia’s future tax system: report to the Treasurer: part two—detailed analysis, Commonwealth of Australia, Canberra, 2010.
Senate Economics References Committee, Out of reach? The Australian housing affordability challenge, The Senate, Canberra, 2015.
Back to Parliamentary Library Briefing Book
For copyright reasons some linked items are only available to members of Parliament.
© Commonwealth of Australia

Creative Commons
With the exception of the Commonwealth Coat of Arms, and to the extent that copyright subsists in a third party, this publication, its logo and front page design are licensed under a Creative Commons Attribution-NonCommercial-NoDerivs 3.0 Australia licence.